
I'm building my own code editor. It's called Helm, it's written in Rust, and it runs on macOS. The goal for v1 is simple to say and hard to do. It should open in under 200 ms, handle TypeScript, JavaScript, Go and Rust with full language-server support, and let coding agents work inside it.
Here's the twist. I'm not writing the code. Agents are. My job is to approve the specs and review every PR. This is how the first three days went, from an empty repo on Oct 13 to a working text core on Oct 15.
A quick honesty note before we start. There's no window yet. You can't open Helm and type in it, so none of the speed goals have been measured. What I do have is a text buffer, undo that works across files, multiple cursors, a keymap engine, 297 passing tests, and a CI job that benchmarks every PR.
Why I didn't just keep using VS Code
VS Code and its forks, Cursor included, run their UI on Electron, which is basically a Chrome browser plus Node. Extensions run in their own Node processes. Microsoft's extension host docs say that setup keeps extensions from freezing the UI. It doesn't make them light.
I wanted real numbers on how heavy it is, and honestly the best I found is old. In Joe Allen's comparison on Ubuntu 14.04, VS Code used 339,512 KiB of memory for a tiny C file. Sublime used 45,800 KiB. A 5.8 MB XML file took VS Code 22 s to open and Sublime 1 s. Today's VS Code is surely different, but I couldn't find a recent careful test.
So my plan is to drop the heavy runtimes instead of trying to tune them:
- Draw on the GPU. Helm uses GPUI, the UI toolkit Zed built. It's Apache-2.0, so I can use it freely.
- Keep text in a rope with cheap snapshots. A background thread can parse or search a snapshot while I keep typing in the live buffer.
- Use native language servers. That means TypeScript 7, which is the Go port, plus gopls and rust-analyzer. None of them need Node, so Helm doesn't ship Node at all.
- Skip extensions in v1. The four languages are built in.
- Run agents in their own processes. They talk to Helm over ACP, the Agent Client Protocol, so their memory never lives inside the editor.
One thing I can't fix is language-server memory. rust-analyzer has user reports of 12 to 16 GB on a big workspace, and that happens in every editor. So Helm measures its own memory separately from the servers.
I wrote the plan before any code
Day one started with three docs: research notes, a PRD with an ID on every requirement, and a plan with eleven decisions already locked in. The plan builds the editor from the bottom up in eight phases, from a text core with no window all the way to the agent panel. A phase only starts when the one before it passes its gate.
Phase 1 has no window on purpose. The rope and undo code is where the sneaky bugs live, and it's much easier to test before there's any rendering in the way.
Here are the speed goals. These are targets I picked from the research, not numbers Helm has hit.
| ID | What | Target |
|---|---|---|
| NF-1 | Keypress to pixel, the editor's share | under 5 ms average |
| NF-2 | Frame time scrolling a 10k-line file | p99 under 8.33 ms (120 Hz) |
| NF-3 | Cold start to first frame | under 200 ms |
| NF-4 | Memory, one file open, no servers | under 100 MB |
| NF-5 | Open a 100 MB file and jump to the end | under 1 s, UI never blocks |
| NF-7 | Rope edits and offset lookups | no regression over 5% |
Right now I can only check NF-7. The rest need a window, and that's Phase 2.
I made it hard for agents to cheat
Agents chase whatever you measure. If a test is in the way, an agent might just loosen the test. So I spent the first day on guardrails before any editor code existed. By the end of Oct 13 I had a workspace of ten crates, CI on macOS and Linux, and these checks:
- The usual stuff. Every PR runs
cargo fmt --check, clippy with warnings as errors, the tests, andcargo-denyto block copyleft dependencies. Zed's editor code is GPL and Helix is MPL-2.0. Agents have seen both, so my rules also say never copy from them. - Protected paths. If a PR touches the task specs, docs, CI, benchmark code, the budgets file or an existing test, it fails unless it has the
approved-protectedlabel. Only I add that label. The check runs from main's copy of the workflow, so a PR can't edit the check to sneak past it. - Benchmarks against the base commit. The
benchjob runs the benchmarks on the PR's base and on its head, on the same machine, three rounds each, taking turns. If head is more than 5% slower, the PR fails. Shared CI machines are way too noisy to compare against a fixed number, so comparing two commits on one machine was the only fair option I found.
Then I tried to break it. Eight throwaway PRs, #4 to #9 plus #12 and #13, threw bad formatting, a clippy warning, a failing test, a GPL dependency, edits to protected files and benchmark noise at CI. None of them got merged.
Every task goes through two PRs
Each task is a file in tasks/. It says what to build, which PRD items it covers, which crates it can touch, the exact public interface and the acceptance tests. That file is the agent's whole brief. Then the task goes through two PRs.
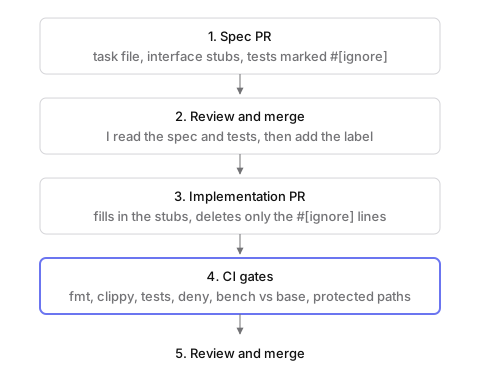
The tests merge before the code that has to pass them, so the agent writing the code can't also write the test it's graded on. Source: README.md and docs/plan.md in shubhook/helm.
The first PR is the spec. It adds the task file, the interface with empty todo!() bodies, and tests marked #[ignore]. I read it and merge it. Then a second agent writes the real code, fills in the bodies and deletes the #[ignore] lines. Deleting those lines counts as touching protected tests, so even a good implementation PR needs my label. When I review it, I check that those lines are the only test change.
My guess, and it's just a guess, is that I'm the bottleneck here and not the agents. They can open PRs faster than I can read them. Keeping each task inside one crate keeps my reviews short.
Seven tasks landed in two days
The first real code, the T-101 spec, merged early on Oct 14. By the evening of Oct 15, seven tasks had made it through both PRs.
| Task | What it adds | Spec PR | Code PR | Merged |
|---|---|---|---|---|
| T-101 | Buffer trait over ropey, with byte, char, line and UTF-16 offset conversions | #16 | #18 | Oct 14 |
| T-102 | Transactions with undo and redo, including one transaction across several buffers | #19 | #21 | Oct 14 |
| T-104 | Line-ending and BOM detection that writes files back byte for byte | #20 | #22 | Oct 14 |
| T-103 | Buffer versions and snapshots that don't copy the text | #24 | #25 | Oct 15 |
| T-105 | Selections and multiple cursors, with property tests | #23 | #26 | Oct 15 |
| T-110 | Amend, so a run of keystrokes undoes in one step | #28 | #31 | Oct 15 |
| T-106 | Command registry and a keymap engine with modes | #29 | #30 | Oct 15 |
T-110 wasn't in my original plan. The T-105 spec pointed out that a run of typed characters should undo as one step, and it sketched a way to do it as an idea for later. I liked it, so it became its own task.
A couple of these might look odd. UTF-16 is in T-101 because language servers count positions in UTF-16 by default. Snapshots in T-103 are what the whole design leans on. A worker thread reads a snapshot, sends back a result tagged with the version it read, and the UI throws it away if I've typed since.
There's twice as much test code as real code
On main at b9ce2d1, cargo test --workspace runs 297 tests and every one passes. That's 167 in helm-text, 123 in helm-editor and 7 in helm-bench. Seven of the test files use proptest, which throws generated inputs at rules like "typing at N cursors gives the same text as N single edits".
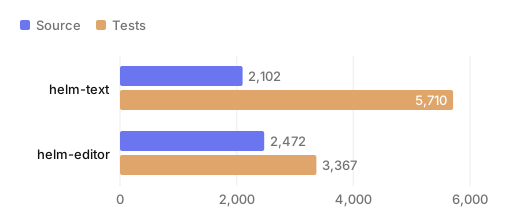
Both working crates have more lines of tests than of code, and the text core has 2.7 times as many. Source: wc -l over src/ and tests/ at b9ce2d1, blank lines and comments included.
In total the two crates have 4,574 lines of code and 9,077 lines of tests. helm-bench adds 453 lines of harness and 640 lines of benchmarks. The other seven crates are still one-line stubs, and the helm binary is five lines.
The benchmarks catch slowdowns, they don't measure speed
Each task added a benchmark on a 10 MB file full of ASCII, accented letters, Chinese and emoji, with both LF and CRLF line endings. These are the head times from the bench job on PR #31, which ran on a GitHub-hosted Linux machine.
| Benchmark | What it does | Head time |
|---|---|---|
text/insert_middle_10mb | One insert in the middle of the file | 2.62 µs |
text/byte_to_line_10mb | 1,024 byte-offset to line conversions | 85.20 µs |
text/utf16_to_byte_10mb | 1,024 UTF-16 to byte conversions | 297.57 µs |
transactions/apply_undo_100_edits_10mb | One transaction of 100 edits, applied and undone | 46.05 µs |
snapshots/snapshot_1024x_10mb | 1,024 snapshots taken back to back | 24.40 µs |
snapshots/apply_undo_holding_snapshot_10mb | An edit and its undo while a snapshot is held | 1.28 µs |
encoding/decode_encode_bom_10mb | Read and write a 10 MB file with a BOM | 6.019 ms |
editor/type_undo_1000_cursors_10mb | Type one character at 1,000 cursors, then undo | 936.84 µs |
amend/type_100_chars_undo_10mb | Type 100 characters as one undo step, then undo | 68.77 µs |
Please don't read these as "Helm is this fast". The same benchmarks ran about twice as slow in the job for PR #30, on a different machine the same day. Typing at 1,000 cursors took 1.560 ms there instead of 936.84 µs. Even inside the #31 job, encoding came out 19% faster on head than on base, and that PR didn't touch encoding at all. That's how noisy these machines are. The gate still works because base and head run side by side in one job. Every benchmark in both jobs stayed inside the 5% limit.
Reviews still catch stuff the benchmarks miss. When Claude reviewed T-110 for me, it found that if you select all of a 10 MB file and type over it, every keystroke after that copies all the replaced text. That cost 1.45 ms per key in a release build. It's under my 5 ms target at 10 MB, but it grows with the selection, so I'd guess a 100 MB selection breaks it. I haven't measured that. The fix is small: move the text instead of copying it. It's on my list.
What's next
Phase 1 has three tasks left. They're all in helm-editor, so they go one at a time.
- T-107, VS Code keys. The spec is up as draft PR #32, with 39 bindings for arrows, word and line jumps, selecting, and deleting by word or line, plus 57 tests. The bindings came from memory of VS Code's Mac defaults, so I still need to check them against VS Code's official list.
- T-108, Vim modes. Normal, insert and visual, with motions, operators and counts.
- T-109, the rest of Vim. Text objects, registers,
.repeat and:w:q:e.
After that, Phase 1's gate checks that the property tests pass and the rope baseline is recorded. Then Phase 2 opens the actual window, and I finally get to measure startup, keypress and memory for real. Until then, they're just targets.
If I'm honest, speed isn't my biggest worry. Scope is. An editor I'd use every day also needs a file tree, search, a terminal, git, proper text input and all the language-server features, and Zed has had a funded team on that for years. I'll call v1 done when I spend a full week on real TypeScript, JavaScript, Go and Rust work in Helm without opening VS Code or Cursor. You can follow along at github.com/shubhook/helm.
Sources
- shubhook/helm, the repository, including docs/prd.md, docs/plan.md, docs/research.md and tasks/, at b9ce2d1
- Bench job for PR #31 and bench job for PR #30, GitHub Actions, Oct 15, 2026
- Extension Host, Visual Studio Code docs
- Editor performance comparison, Joe Allen
- Leveraging Rust and the GPU to render user interfaces at 120 FPS, Zed
- rust-analyzer memory on the Zed project, rust-analyzer discussion #20871